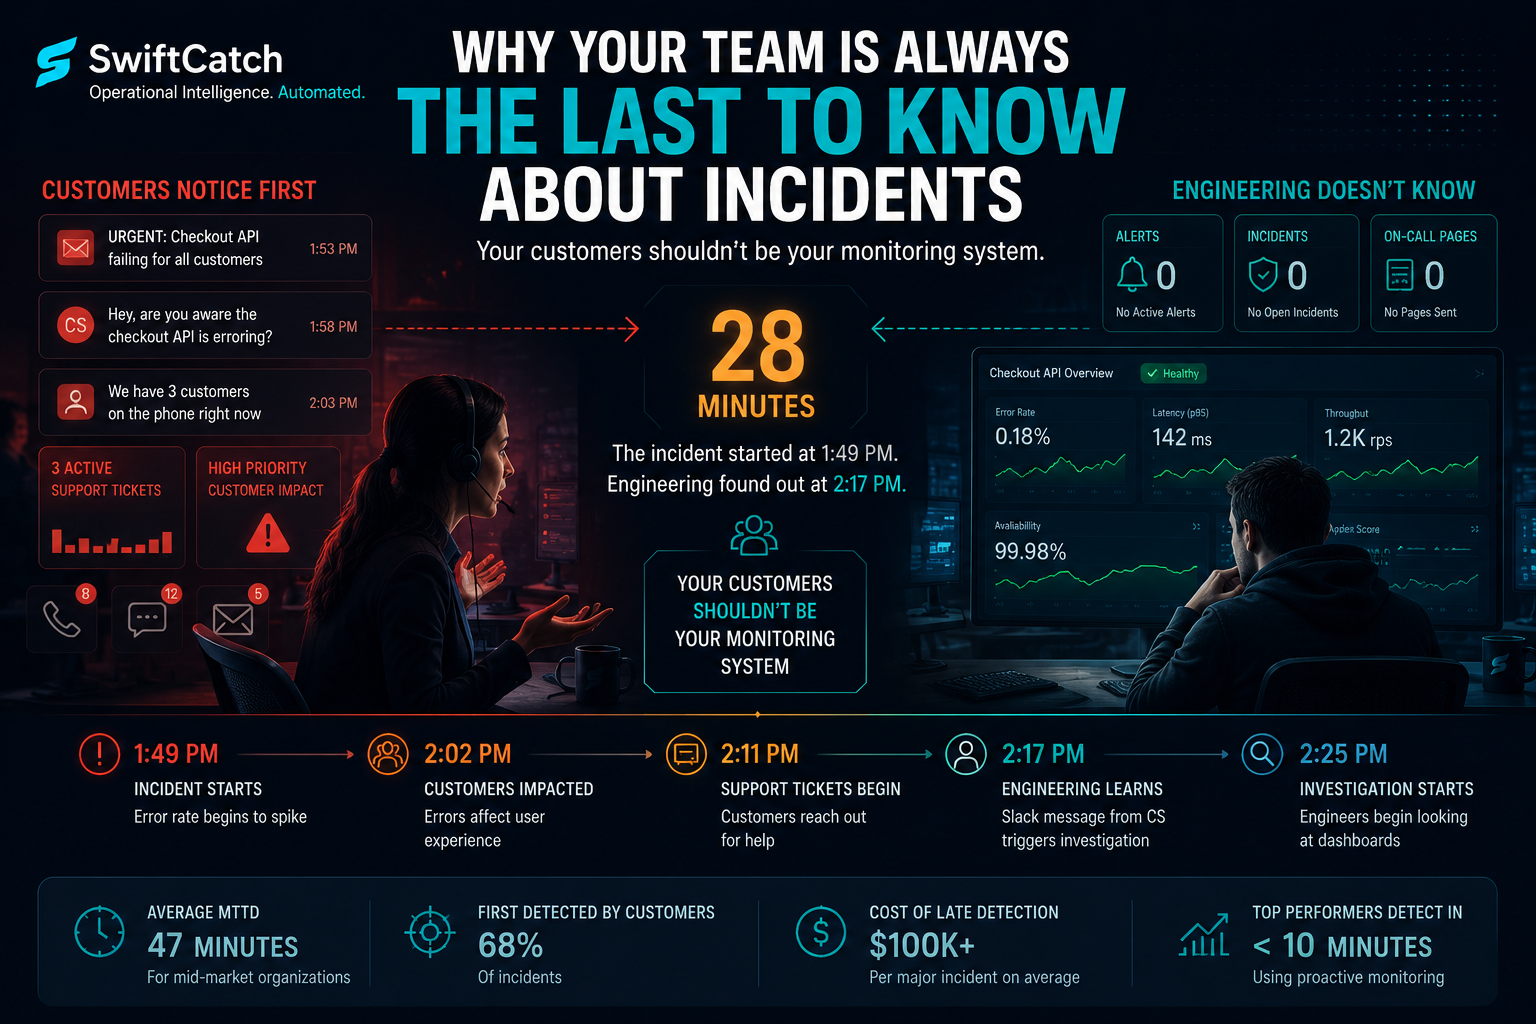
Picture the scene: it's 2:17pm on a Tuesday. An engineer on your team gets a Slack message from someone in customer success: "Hey, are you aware the checkout API is erroring? We've got three customers on the phone." The engineer opens Datadog. The error rate graph shows a spike that started at 1:49pm. Twenty-eight minutes ago.
Nobody on the engineering team noticed. No alert fired. The incident was 28 minutes old before anyone looked at it — and the first person to look was responding to a customer complaint, not a monitoring system.
This is not an edge case. It's the most common incident detection pattern in mid-market engineering organizations. And the fact that your monitoring stack didn't catch it isn't always because you have bad tools. It's usually because of how those tools are configured.
The MTTD Problem Nobody Talks About
The industry spends considerable energy on MTTR — Mean Time to Resolve. It's a visible metric, it's easy to measure from incident tickets, and reducing it has obvious ROI. But MTTD — Mean Time to Detect — is where the real leverage is, and most teams have no systematic measurement of it at all.
The math is straightforward: every minute of MTTD is a minute of customer impact that didn't have to happen. A team that cuts MTTD from 47 minutes to 8 minutes on an incident that takes 2 hours to resolve has eliminated 39 minutes of customer-facing downtime — without touching MTTR at all.
But MTTD doesn't show up in most incident retrospectives, because most teams don't know when the incident actually started — only when someone noticed it. These are very different numbers, and conflating them is how you end up thinking your detection posture is better than it is.
How Incidents Actually Get Detected
Before fixing detection, it helps to be honest about how incidents are currently being found. In our experience working across engineering organizations, detection falls into five tiers — and most teams are operating in the bottom two.
Customer Report
"Hey, is your API down?" — A customer, a support ticket, or an account manager relaying a complaint. The incident has been running long enough to affect enough people that someone outside your team noticed before anyone inside did.
Internal Observation
Someone on the team happened to look at a dashboard and noticed something wrong. This is better than a customer report, but it's still luck — not system. It depends on who happened to be watching, when.
Threshold Alert
An alert fires because a metric crossed a fixed line — error rate above 5%, latency above 2000ms, CPU above 90%. Better than tiers 1 and 2, but threshold alerts are inherently reactive: the incident already exists before the alert fires.
Anomaly Detection
A system detects that a metric is behaving differently from its established baseline — before it crosses a threshold. Catches gradual degradation, unusual patterns, and leading indicators that threshold alerts miss entirely.
Leading Indicator Monitoring
Upstream signals are monitored that predict downstream failures before they occur. Queue depth rising before throughput drops. Connection pool exhaustion before timeouts. Deployment metrics before error rate spikes. The incident is caught before it becomes an incident.
Most organizations we work with are at Tier 2–3. They have dashboards and they have threshold alerts, but the dashboards get checked reactively and the alerts fire after the problem is already visible to customers.
Why Threshold Alerts Fail at Detection
Threshold alerts are the default configuration in every monitoring tool, and they're the source of most of the detection gap. The problem isn't that they're useless — it's that they're designed to tell you when something is already bad, not when something is becoming bad.
Consider a service that normally handles 1,000 requests per minute with a 0.1% error rate. An incident begins at 1:00pm when a memory leak starts causing gradual degradation. By 1:15pm, the error rate is 0.8% — elevated, but still under the 5% alert threshold. By 1:30pm it's at 3%. At 1:47pm it crosses 5% and the alert fires.
The incident has been running for 47 minutes before detection. The threshold alert didn't fail to work — it worked exactly as configured. But it was configured to tell you about problems that are severe, not problems that are developing.
The key distinction: Threshold alerts measure absolute state. Anomaly detection measures change relative to baseline. Catching an error rate that went from 0.1% to 0.9% requires the second approach — the 0.9% is well below any reasonable threshold, but the 9× change is a meaningful signal.
What Early Detection Actually Requires
Baseline-relative alerting
Instead of alerting when error rate exceeds 5%, alert when error rate exceeds 3× its rolling 7-day average for the same time window. This catches anomalies that are significant relative to normal behavior, regardless of absolute level. A service that normally runs at 0.1% error rate should page at 0.4% — a threshold alert set at 5% would miss it entirely.
Leading indicator coverage
The most valuable detection signals are upstream of the user-facing metrics most teams monitor. Memory growth rate predicts OOM errors. Connection pool saturation predicts timeout spikes. Message queue depth predicts processing delays. If you're only monitoring the outputs — error rates, latency, availability — you're always one step behind the incident.
Correlated signal detection
A single metric moving slightly is often noise. Two or three correlated metrics moving simultaneously in a consistent pattern is almost always a real signal. A detection system that looks for correlated anomalies across services produces far fewer false positives than threshold alerts on individual metrics — and catches incidents that any single metric would miss.
Deployment awareness
A disproportionate share of incidents start within 30 minutes of a deployment. A detection system that knows when a deploy happened — and increases sensitivity on downstream metrics immediately after — catches deployment-induced degradation far earlier than one that treats all time windows equally.
The Audit You Can Do This Week
Before investing in new tooling, run this audit on your last 10 incidents. For each one, answer:
- When did the incident actually start? (Based on metrics, not when someone noticed)
- How was it first detected? (Customer report / internal observation / alert / anomaly detection)
- How long between start and detection?
- Was there a leading indicator that fired — or could have fired — earlier?
Most teams that run this exercise discover their actual MTTD is 2–4× higher than they assumed, and that the majority of incidents were detected via customer report or internal observation rather than automated alerting. That gap is your detection maturity gap — and it's measurable, improvable, and worth quantifying in dollar terms before your next planning cycle.
A useful target: Teams with mature detection postures aim for 85%+ of incidents detected via automated systems (Tiers 3–5), with customer-reported incidents under 10%. If you're not tracking this ratio, start. It's the single most useful leading indicator of detection health.
The monitoring stack you have is almost certainly capable of better detection than you're currently getting from it. The gap is usually configuration, not capability — and it closes faster than most engineering managers expect once the right metrics are being watched in the right way.