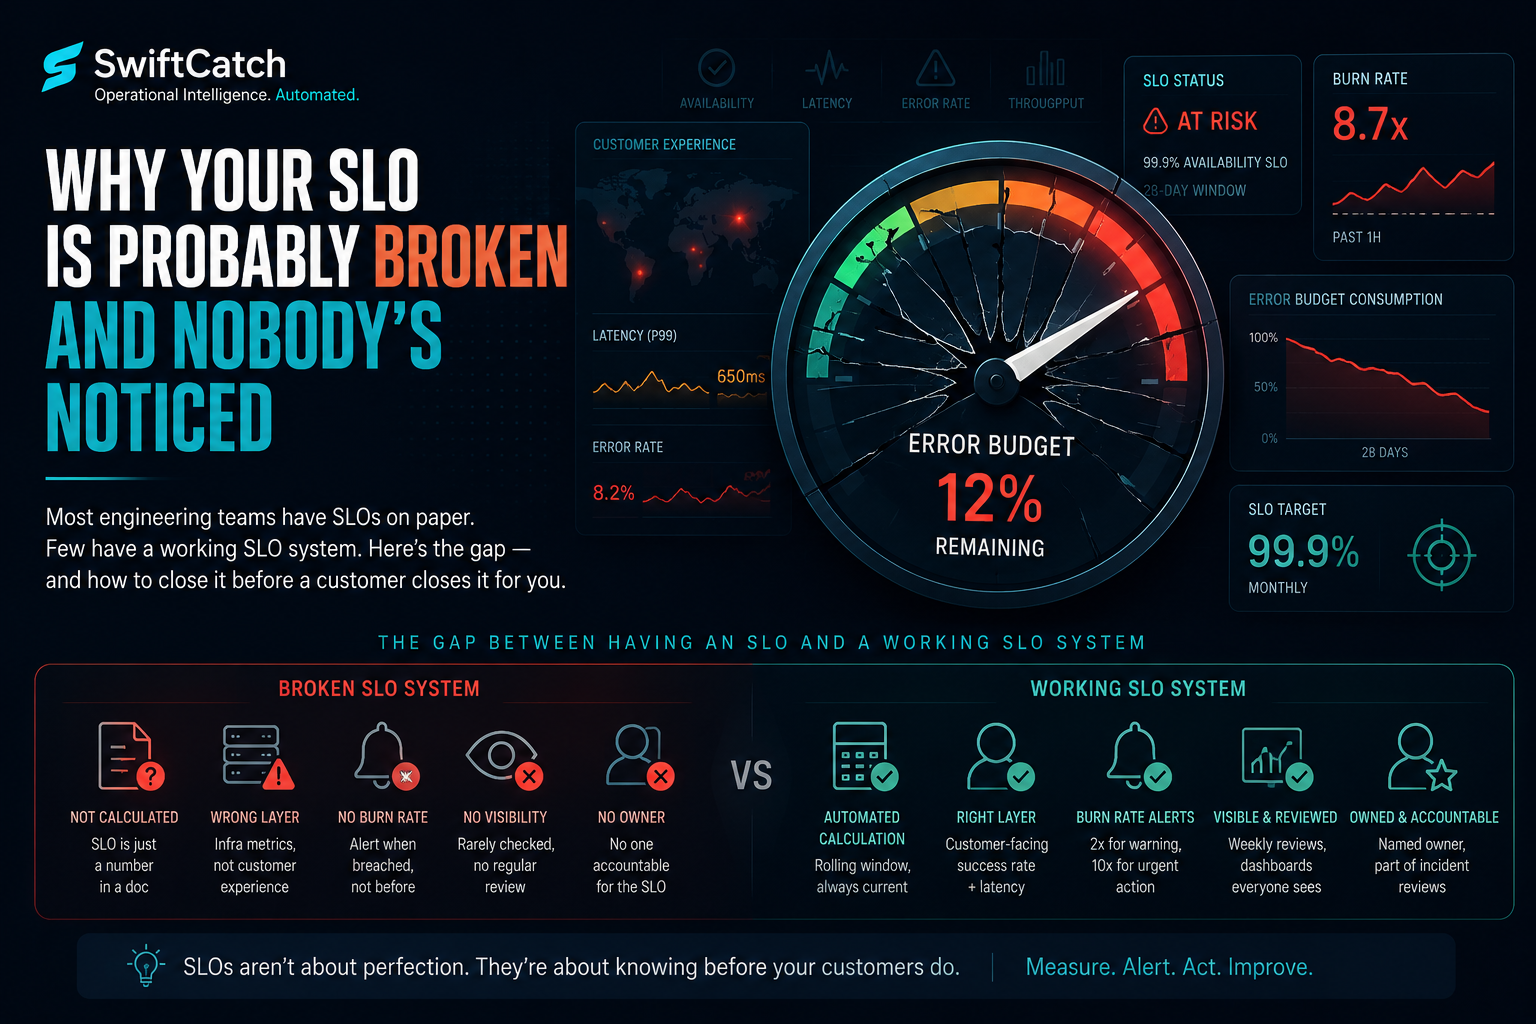
Your engineering org probably has SLOs. You may have an SLO document, a target — 99.9%, maybe 99.95% — and a dashboard somewhere with uptime metrics on it. You feel reasonably confident that someone would notice if things went badly wrong.
Here's the uncomfortable question: when did you last check whether your SLO is actually being met? Not during an incident. Not when a customer emailed. Systematically, on a regular cadence, with error budget math behind it?
For most engineering organizations, the honest answer is: rarely, or never. And that gap — between having an SLO and having a working SLO system — is exactly where customer impact hides.
The SLO Anti-Patterns We See Most
1. The SLO That Nobody Calculates
The target exists. The metric exists. But no one is computing the actual error budget, tracking burn rate, or generating alerts when the budget starts moving fast. The SLO is a number in a doc, not an operational tool.
In practice, this means the SLO only comes up in retrospective conversations after something already went wrong. "Were we in SLO?" is asked after the incident, not before it.
The cost: SLO breaches discovered late are expensive on two dimensions — customer impact that already happened, and the trust conversation with stakeholders that now has to happen reactively.
2. The SLO Measured at the Wrong Layer
This is subtle but important. Many teams measure availability at the infrastructure layer — "is the service up?" — when their customers experience reliability at the product layer: "did my API request succeed within 500ms?"
A service can be technically "up" while returning errors at 15%, exceeding P99 latency, or timing out for users in specific regions. Infrastructure-layer SLOs miss all of this. And the difference matters because your SLA is probably with your customers about their experience, not your server's heartbeat.
3. The SLO With No Burn Rate Alert
An error budget is a time-based resource. If you're burning through it 10× faster than expected, you'll exhaust it in a tenth of the time — and you'll only find out when the budget hits zero, at which point you've already violated your SLO.
Burn rate alerting catches this. Without it, you're watching the gas gauge only when you think to look at it — not when it starts dropping toward empty.
4. The SLO Nobody's Accountable For
The SLO lives in a doc, the dashboard exists, but there's no owner — no team or individual whose job it is to watch it, respond to burn rate changes, and report on it in a regular forum. In the absence of ownership, SLO drift goes unnoticed until it compounds into an outage or a renewal conversation.
What a Working SLO System Actually Looks Like
A working SLO system has five components. Most teams have one or two of them.
| Component | Broken | Working |
|---|---|---|
| Measurement | Infrastructure uptime | Customer-facing success rate + latency |
| Calculation | Manual / periodic | Automated, rolling window (28-day or 30-day) |
| Alerting | Alert when SLO breached | Burn rate alerts at 2× and 10× normal consumption |
| Visibility | Dashboard exists, rarely checked | Error budget reviewed in weekly/sprint reviews |
| Accountability | No clear owner | Named owner, included in incident review process |
The Burn Rate Concept Most Teams Skip
Error budget burn rate is the most powerful — and most underused — concept in the SLO toolbox.
Burn rate tells you: at the current rate of error, how quickly will the error budget be exhausted? A burn rate of 1.0 means you're consuming budget at exactly the rate your SLO expects — you'll use it all up in 30 days. A burn rate of 10 means you'll exhaust it in 3 days.
The right alert strategy: Page on-call at a high burn rate (10× or higher) with a short lookback window. Notify via ticket at a lower burn rate (2×) with a longer lookback. This catches both fast-burning incidents and slow accumulating degradation.
Without burn rate alerting, you can have a slow, steady trickle of errors that individually look fine on any single dashboard check — but collectively exhaust the budget before anyone notices. This is the SLO failure mode that generates the most uncomfortable quarterly review conversations.
How to Know If Your SLO Is Actually Working
Ask your team these four questions. If any answer is "I'm not sure" or "we'd have to check," you have a gap:
- What is your current error budget remaining for this month? (Should be available in under 10 seconds)
- What is your current burn rate? (Should be on a dashboard or auto-reported)
- When was the last time a burn rate alert fired? (Should be a known event with a postmortem)
- Who owns the SLO review in your weekly cadence? (Should have a specific name attached)
These questions aren't gotchas. They're the minimum bar for an SLO that's doing operational work rather than just occupying a document.
The Operational Cost of a Broken SLO
The most expensive thing about a broken SLO system isn't the technical debt — it's the asymmetry of information. Your customers know about reliability problems before you do. They're experiencing the impact, watching their own metrics, and making renewal decisions based on reliability data you haven't seen yet.
An engineering organization that catches SLO drift early — via burn rate alerts, in their own tools, before customer reports come in — operates with fundamentally different leverage. They have time to respond, communicate proactively, and prevent the breach rather than explain it.
The gap between those two operational postures is usually a few dashboards, a couple of alerts, and a weekly review that takes 15 minutes. The gap in customer trust it prevents is worth considerably more.